Sofia Hartmann · 11 September 2026
How Census Data and Community Input Are Driving Safety Updates Along Protected Woodland Trails
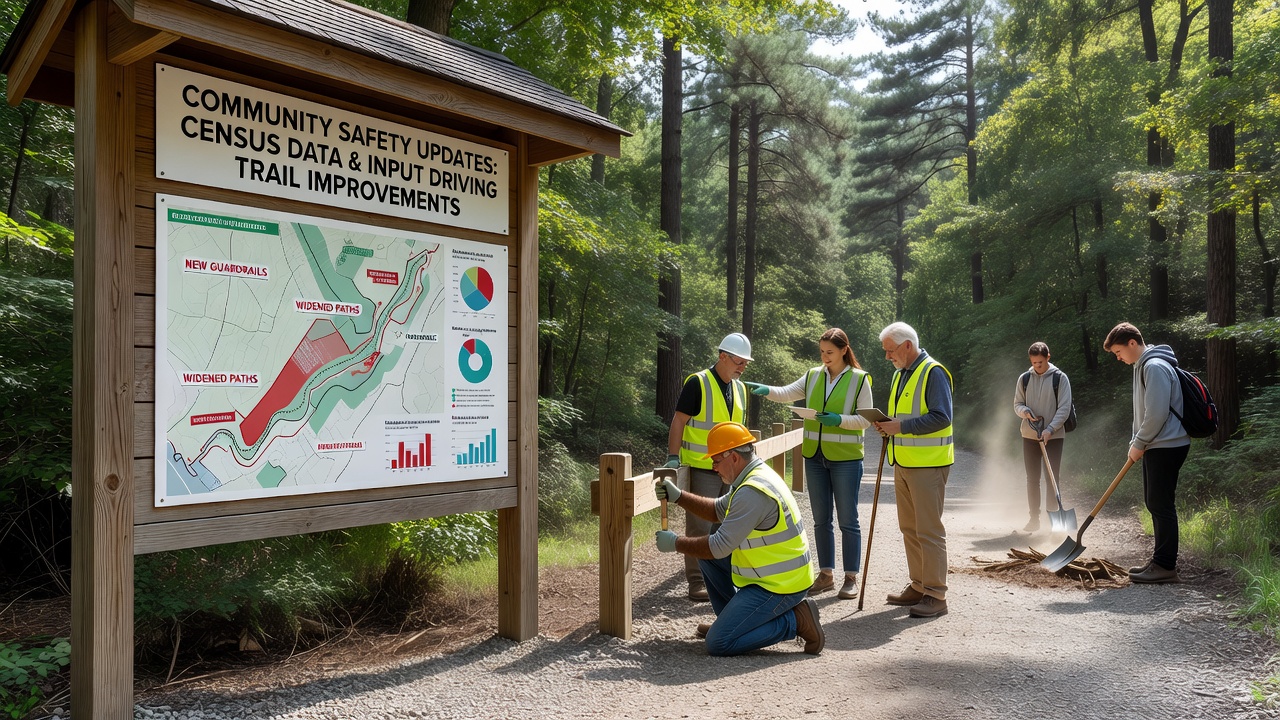
Protected woodland trails across several regions now incorporate safety modifications informed by population statistics and resident feedback rather than assumptions alone, and this approach has produced measurable shifts in incident rates since systematic tracking began. Census records supply details on nearby population density, age distributions, and mobility patterns that planners use to anticipate trail usage volumes and visitor demographics while community consultations reveal specific hazards that numbers alone cannot highlight.
Census Records Shape Trail Planning Priorities
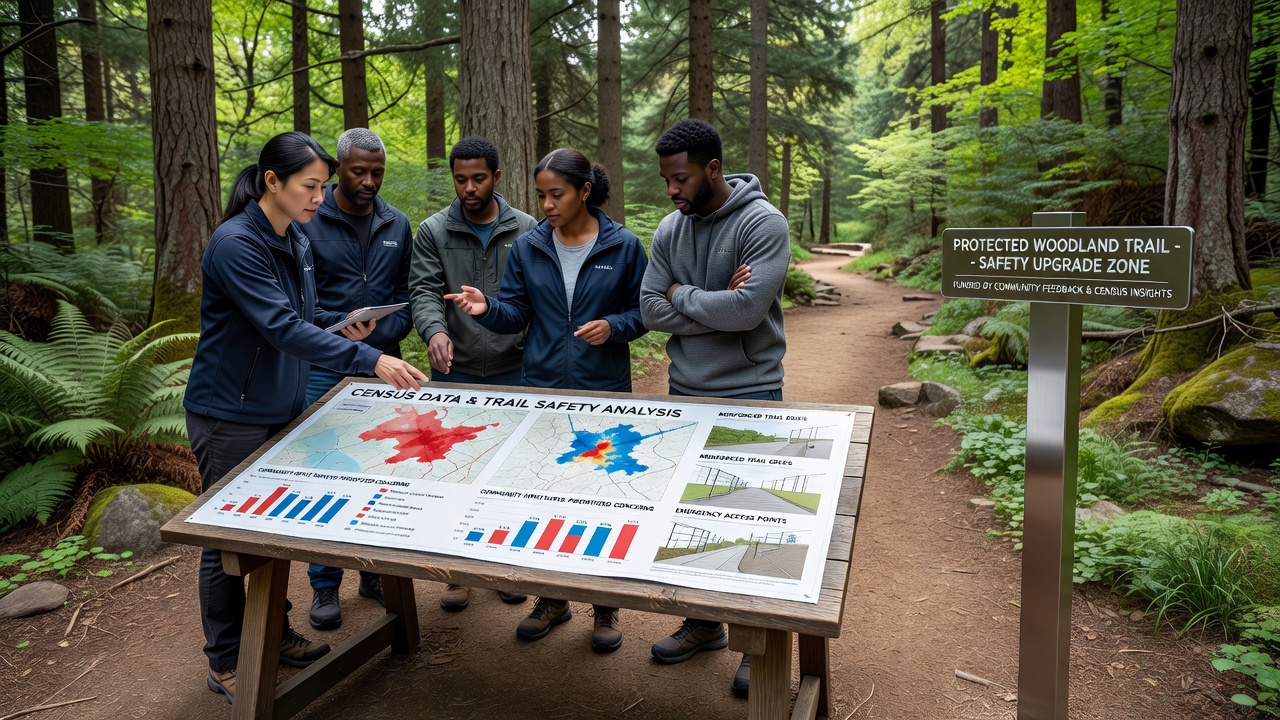
Demographic datasets from national statistical agencies allow land managers to map high-traffic corridors near residential zones where older adults or families with children represent larger shares of the population, and these profiles guide decisions about where to install handrails, widen path surfaces, or add emergency call points. In areas where census figures indicate rising numbers of visitors under age eighteen, crews have added interpretive markers and lower sight-line barriers that reduce falls without obstructing scenic views. Researchers at institutions tracking visitor logs have cross-referenced these statistics with trail counter data to confirm that segments serving denser neighborhoods experience peak loads on weekends, prompting timed patrols and seasonal surface maintenance schedules.
Community Input Identifies Localized Hazards
Public meetings, online reporting portals, and trail steward programs collect firsthand accounts of slippery roots, blind corners, and wildlife crossings that statistical models overlook, and this qualitative layer refines the placement of lighting, fencing, and signage. When residents near one protected network reported repeated encounters with uneven footing after heavy rain, crews responded by installing permeable gravel overlays and drainage channels that addressed the exact locations flagged in submissions. Participation rates in these input channels have increased as digital platforms allow photo uploads and GPS-tagged comments, giving planners precise coordinates for interventions that align with both usage patterns and resident concerns.
Safety Modifications Implemented Through Combined Data Streams
Trail authorities have introduced several categories of updates where census indicators and community reports converge. Reinforced edging along steep drop-offs appears in corridors identified by both high child-visitor estimates and repeated parent-submitted photographs of near-misses. Solar-powered wayfinding lights activate at dusk in stretches where census data shows elevated evening foot traffic from shift workers, and motion sensors limit energy use while maintaining visibility. Emergency locator markers now sit at intervals determined by average response times reported in community surveys, and these markers carry QR codes that connect directly to local dispatch systems. In September 2026 additional solar units and updated maps will roll out along three priority loops following the latest round of integrated analysis.
Measuring Outcomes From Integrated Approaches
Trail networks that adopted this dual-source methodology report declines in reported slips, trips, and lost-visitor incidents compared with corridors still using traditional inspection schedules alone. Maintenance crews note that targeted interventions reduce overall material costs because upgrades concentrate where usage and hazard reports intersect rather than spreading resources uniformly. Data from trail counters and incident logs continue to feed back into the planning cycle, allowing adjustments before seasonal peaks such as autumn foliage viewing or spring school outings. Observers note that partnerships between statistical offices and local forestry districts have streamlined data-sharing agreements, shortening the interval between census releases and on-the-ground changes.
Conclusion
Protected woodland trails continue to evolve through the steady application of population statistics and resident observations, producing safety features that reflect actual visitor profiles and reported conditions. As new census releases arrive and digital input channels expand, managers expect further refinements that keep paths accessible while lowering risk across varying terrain and user groups.